Identifying a Stock Market Bubble: How To Avoid The Next Stock Market Crash


Identifying a Stock Market Bubble To Avoid a Crash
With the memory of the 2008 / 2009 stock market crash still fresh in investor’s minds, many investors are wondering: How Identify a Stock Market Bubble To Avoid The Next Stock Market Crash? While trying to get out at the exact top of a stock market bull run is a futile effort, there are plenty of stock market indicators that can be monitored to develop a sense regarding when stocks are grossly overvalued and a stock market bubble has formed. Understanding these indicators will help you understand when the chances of a stock market crash are heightened. These same indicators can be used to assess when stock market bottoms are likely occurring, and therefore they are well worth learning about to gauge both stock market tops and bottoms. Just keep in mind that the stock market indicators outlined in this article are used to make determinations regarding when the stock market is likely to make long term trend reversals, not which way stocks will trade over the next week or next month.
How To Avoid The Next Stock Market Crash Using Common Stock Market Valuation Methods
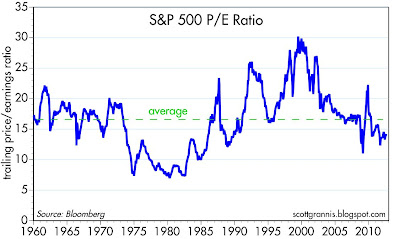
The most common stock market valuation method is the stock Price-to-Earnings Ratio (P/E Ratio). The P/E Ratio for any stock can be determined by dividing a stock’s price by the reported earnings over the past twelve months. For example, if Bank of America (BAC) is selling for $10 per share, and it reported earnings of $0.50 per share during the past year, then BAC’s stock has a P/E Ratio of 20.
The average P/E Ratio for all stocks trading on the stock market at any given time has varied dramatically over the years, from below 10 to above 25. Looking back all the way to the 19th Century, the average P/E Ratio for the entire stock market is approximately 15, which can be used as a benchmark to assess whether the current stock market is currently overvalued or undervalued. For the purposes of avoiding the next stock market crash, when the average P/E Ratio for stocks in the Standard and Poors 500 Index (S&P 500 Index) is above 15, it is time to pay close attention to the stock market news flow and look at other confirming indicators of a stock market top nearing (but not necessarily take any action). When it goes above 18, it is time to examine other confirming stock market top indicators closely, and consider taking action. However, the stock market may still have a long way to run on momentum and irrational exuberance after surpassing the 18 warning level. For example, in the year 2000 the average S&P 500 Index P/E Ratio went to 30, which was followed by a stock market crash that saw the NASDAQ lose 75% of its value and the S&P 500 Index lose 45% of its value.
The thing that is tricky about the average stock market P/E Ratio valuation method is that during different eras investors are willing to pay more or less for stocks, based on other forces than just reported company earnings. For example, during periods of high growth, investors may be willing to buy stocks even when the average stock market P/E Ratio is well above 15, because the earnings growth outlook is so good that they assume the earnings part of the equation will catch up to the price part of the equation.
To counter this fault in the average stock market P/E Ratio, investors take a look at the average S&P 500 Index PEG Ratio. The average S&P 500 Index PEG Ratio = Stock Price / Earnings Over The Past Year / Expected Annual Earnings Per Share Growth Rate. An average S&P 500 Index PEG Ratio below 1.0 tells investors that on average, earnings for stocks is expected to grow significantly over the next year, which can support a higher average current P/E Ratio. Of course, earnings expectations can be and often are wrong, especially when the economy goes from growth to recession, so it is important to also look at the advanced stock market valuation methods outlined in the following section to get a sense as to whether the risk of a stock market crash is high and defensive moves may be warranted.
S&P 500 P/E Ratio Going Back TO 1960
How To Avoid The Next Stock Market Crash Using Advanced Stock Market Valuation Methods
The following are some advanced stock market valuation methods that should be considered when evaluating whether the stock market is overvalued and whether the potential for a stock market crash is high. This is just a sampling of the many advanced stock market valuation methods that are available for review.
Investor Sentiment is a reading of how many investors are bearish (think the stock market will decline) versus how many investors are bullish (think the stock market will increase). Investor’s buying and selling decisions ultimately drive up and down the stock market. Investor sentiment is used as a contrarian indicator by stock market watchers. Market bottoms and tops have historically been marked by excessively bearish investor sentiment (bottoms) and excessively bullish investor sentiment (tops). When Investor Sentiment is excessively bullish, it is time to consider whether a stock market crash may be looming.
The Ratio of Total Market Cap (TMC) Relative to the United States Gross Domestic Product (GDP) is stock market valuation gauge that is one of the best indicators of whether the stock market is undervalued or overvalued at any given point in time. To calculate this ratio, you simply take the total market capitalization of the all the stocks in the stock market and divide it by the latest reported total GDP for the United States. This ratio is also known as the Total Market Cap to Gross Domestic Product (TMC:GDP) Ratio.
In late September 2013, the total market capitalization of the stock market was just over $18 trillion, which equals a TMC:GDP Ratio of 114.6% when using the last reported GDP, which puts the stock market in the Modestly Overvalued range of 90% < Ratio < 115% (see chart below) and close to the Significantly Overvalued range. For updates regarding the current TMC:GDP ratio, see: Where Are We With Market Valuations?
Ratio of Total Market Cap (TMC) Relative to the United States Gross Domestic Product (GDP) Valuation Levels
Ratio = Total Market Cap / GDP
| Valuation
|
|---|---|
Ratio < 50%
| Significantly Undervalued
|
50% < Ratio < 75%
| Significantly Undervalued
|
75% < Ratio < 90%
| Fair Valued
|
90% < Ratio < 115%
| Modestly Overvalued
|
Ratio > 115%
| Significantly Overvalued
|
iM’s Weekly Business Cycle (BCI) Index is recession prediction gauge that the creators claim has provided an eleven week average warning for the past seven recessions that occurred in the United States, with no false positives. This gauge is useful to get out of the stock market ahead of a crash because economic downturns usually cause stock market sell-offs, and occasionally stock market crashes.
iM’s Weekly Business Cycle Index recession prediction gauge includes the following economic parameters in its calculation:
- 10-year treasury yield (daily)
- 3-month treasury bill yield (daily)
- S&P500 (daily)
- Continues Claims Seasonally Adjusted (weekly)
- All Employees: Total Private Industries (monthly)
- New houses for sale (monthly)
- New houses sold (monthly)
iM further refines the BCI Index by using a formula to obtain a six-month smoothed annualized growth rate of the BCI that they call the BCIg (g is for growth). When the BCIg crosses the red zero line while on a downward trend on the chart below, a recession is imminent and it is time to consider taking a defensive position in the stock market, if you have not already done so.
For more information about the BCI and BCIg, see: iM’s Weekly Business Cycle (BCI) Index
iM’s Weekly Business Cycle Index

Stock Market Investing
How To Avoid The Next Stock Market Crash | Wrapping It All Up
It is important to understand that several stock market indicators should be assessed to gauge the valuation of the stock market at any given, as any one indicator could provide a reading that is being affected by temporary factors and is representative of a stock market that is actually overvalued and susceptible to a crash. Stock market indicators may indicate a highly overvalued stock market and a high probability of a stock market crash; however, there has to be something that actually triggers a stock market crash, and this is usually a looming recession, which usually leads to a sharp drop in corporate earnings and subsequently a stock market sell-off, which can quickly become a crash. 2008 was a good example of this dilemma. By the middle of 2008, many stock market indicators were flashing warnings signs concerning overvalued stock market valuation levels and the potential for a stock market crash, but it was not until a banking crisis ensued in the fall of 2008 that the stock market actually crashed.
If a stock market crash is caused by a recession, savvy investors look for an opportunity to get back in for an eventual recovery in stock prices. The time to put money back into stocks is approximately halfway through a recession, when stock market indicators are excessively bearish and the economy appears to be bottoming. Stocks usually start recovering midway through a recession, as investors buy stocks in anticipation of an economic recovery that will eventually send corporate earnings and stock prices higher.
Avoiding A Stock Market Crash

Investing Hubs
- Stock Market Trading Strategies and Valuation Method...
Before delving into the world of stock market trading and investing, it is useful to understand the basic stock market trading strategies and valuation methods that stock market traders and investors use and to trade and invest in the stock market.Th - Using Position Trading Strategies To Profit In The S...
Position Trading can be a highly profitable way to trade for stock market traders who do not have time to constantly keep track of their stock positions. Learn about position trading strategies. - Making Money During a Bear Market
Making money during a bear market is possible and is easier than ever. Buying bear market trading vehicles provides a way to hedge against a stock market downturn, and make money during a sell off. - Using Volatility ETFs To Make Easy Money In The Stoc...
The goal of stock market trading is finding a way to make easy money in the stock market. The following stock market trading strategy is an easy way to make money in the stock market and to hedge.

")